Bitcoin returned to positive territory on June 12 as risk appetite improved after signs of possible U.S.-Iran de-escalation.
Bitcoin traded near $63,700 on June 12, up about 1% over 24 hours, according to crypto.news market data. The asset also gained 1.66% over seven days, showing a recovery from the recent move below $60,000.
The bounce came after traders reacted to signs that U.S.-Iran tensions may ease. President Donald Trump canceled planned strikes on Iran and said a deal could be reached soon, according to reports.
Oil prices fell after the news. Brent crude dropped toward the mid-$80s, easing concern that higher energy prices would keep inflation pressure high.
That shift matters for crypto because oil-driven inflation can keep the Federal Reserve hawkish. Lower geopolitical stress can reduce pressure on risk assets, including Bitcoin and major altcoins.
Bitcoin and major crypto prices turn higher
Ethereum traded near $1,671, up about 0.97% over 24 hours. The token stayed close to the $1,650 support area after a weak week for spot Ethereum ETFs.
BNB traded near $605, while Solana hovered around $66.69 after a 1.95% daily gain. XRP also traded near $1.14, up 3% on the day.
Dogecoin moved near $0.086, while Hyperliquid rose to around $59.17. HYPE was among the stronger major tokens, although it remained weaker over the weekly window.
TRON was the clear laggard among the listed majors. TRX traded near $0.312, down 2.86% over 24 hours and 3.79% over seven days.
The broad rebound shows that traders reduced some risk-off positioning. Still, the move remains early and has not yet erased the damage from the June selloff.
Options data shows fear cooled
Glassnode said Bitcoin broke below the February low before bouncing from the June low. The firm tracked how options traders reacted during the move.
“Selloff Triggers a Temporary Volatility Spike,” said Glassnode.
According to Glassnode, at-the-money implied volatility jumped as $BTC broke below the February low. One-week implied volatility briefly reached 65% before the spike faded.
Front-end volatility then moved back near 40%. That showed options traders did not keep pricing an extended panic move after the bounce.
“Markets still view the selloff as a contained move,” said Glassnode.
Protection demand also rose quickly before fading. One-week skew jumped from 12% to 28% as $BTC fell, showing a rush for downside hedges.
That skew later moved back near 12%. The reversal suggests traders bought protection during the break lower, then reduced hedging as price stabilized.
ETF outflows keep pressure on Bitcoin
Spot Bitcoin ETFs recorded $19.03 million in net outflows on June 11, per SoSoValue data. That marked the fifth straight day of outflows and showed that institutional demand remained cautious.
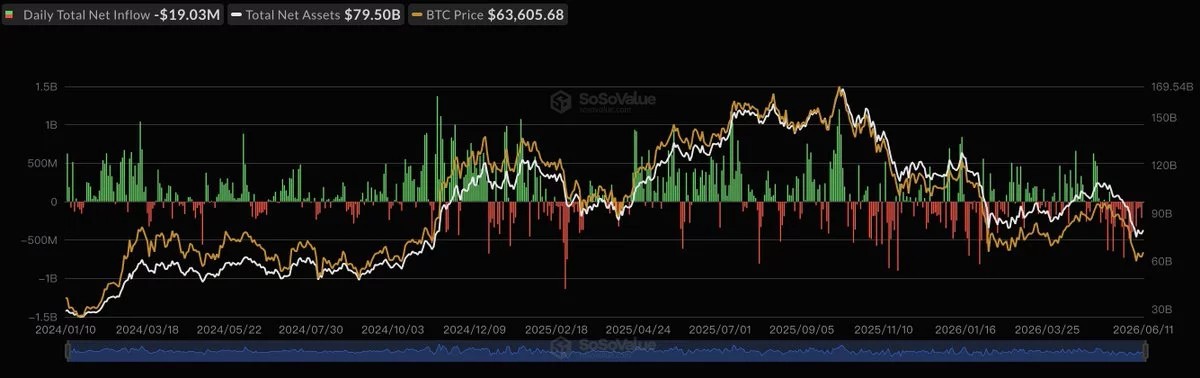
Spot Ethereum ETFs also saw $15.89 million in net outflows on the same day. That marked the third consecutive day of withdrawals from ETH funds.
As previously reported by crypto.news, the June crypto crash came from several pressures arriving together. The market faced a hawkish Fed, Iran escalation, ETF outflows, and a leverage unwind.
SpaceX IPO interest also created a background drain on speculative capital, as previously reported. That report said the IPO wave did not cause the crash alone, but it weakened crypto’s buyer base.
Bitcoin’s latest rebound therefore has to compete with ongoing ETF weakness. If ETF flows turn positive again, the recovery could gain firmer support.
If withdrawals continue, the bounce may struggle to move beyond the next resistance areas.
Traders watch FOMC and $60K support
Several analysts still warned that Bitcoin’s rebound may face another test. Crypto Rover said the four-year cycle remains on schedule, with cycle bottoms historically arriving around September to October of the fourth year.
“The 4-year cycle is running on schedule,” said Crypto Rover.
THE 4-YEAR CYCLE IS RUNNING ON SCHEDULE.
Every prior $BTC cycle, aligned on one chart.
Cycle tops: all printed in the same window.
September-November of year 3.
Exactly where this cycle topped at $124,000.
Cycle bottoms: all printed in the same window. September-October of… pic.twitter.com/gGyktE7tLb— Crypto Rover (@cryptorover) June 12, 2026
Kaz said Bitcoin has reacted poorly around most FOMC events during the bear market. The analyst pointed to June 17 as a possible date for another lower high if price fails to extend.
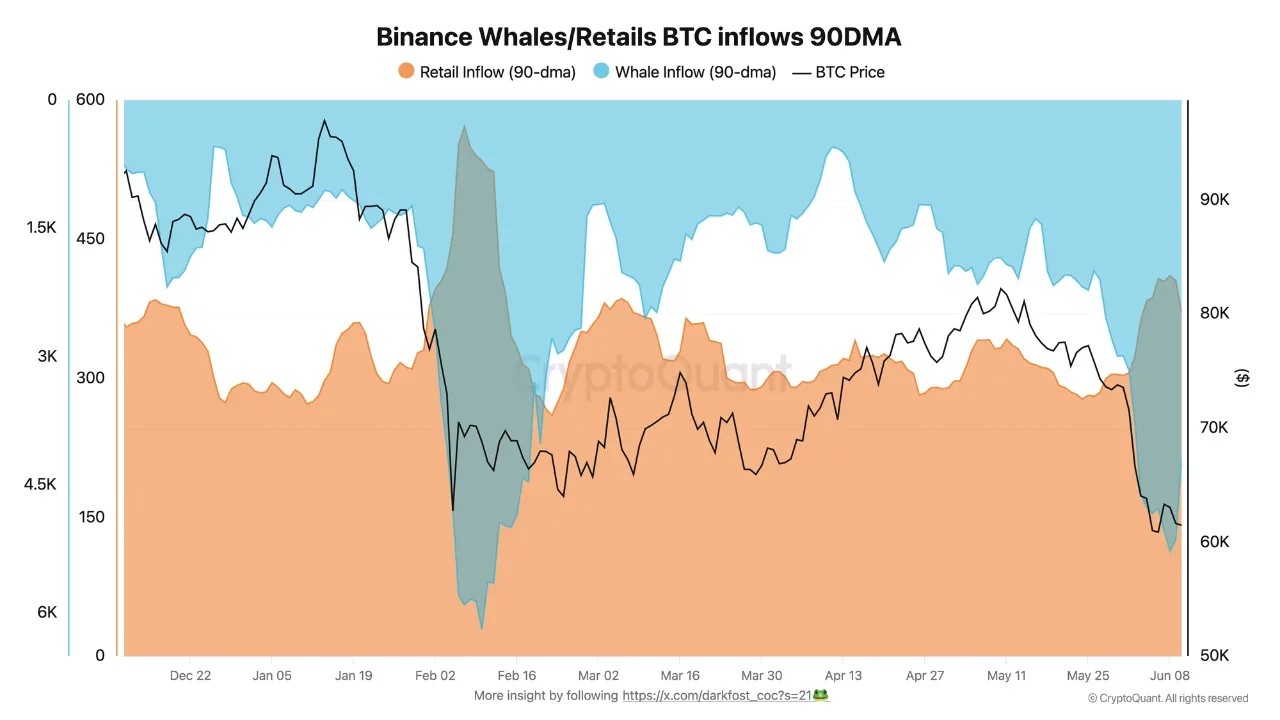
CryptoQuant analyst Darkfost also said both whales and retail traders increased $BTC inflows to Binance as price fell below $60,000. Whale inflows rose to an average of 5,280 $BTC over 90 days, while retail inflows reached about 410 $BTC.
Those exchange inflows can show fear because coins moving to exchanges are often easier to sell. Darkfost compared the behavior with early February, when similar inflows appeared during another move below $60,000.
For now, the key market level remains the $60,000 area. Holding above that zone would support the view that the latest selloff was contained.
A stronger recovery would require Bitcoin to reclaim $65,000 and then build momentum toward $68,000 to $70,000. Until then, the bounce remains a relief move inside a fragile market.