 By cryptoadmin
 $XRP has lately been showing signs that it could turn bullish after a turbulent month. In fact, the month dragged the altcoin to a year-to-date loss of 41%. At the time of writing though, on-chain data seemed to be pointing to the kind of setup that preceded its last major price run.
Whale activity and a network-to-market-capitalisation reading appeared to flag the token as grossly undervalued, mirroring the conditions that fuelled its previous rally.
$XRP’s leverage flush echoes 2024 setup
The Estimated Leverage Ratio (ELR) of the $XRP Ledger, which measures the depth of leveraged capital channelled into $XRP, hinted at the token repeating the pattern that led into its 2024 rally.
During that period, the ELR declined to a low of roughly 0.05 on the chart. A massive flush of leveraged positions in $XRP followed, and the price rallied sharply soon after.
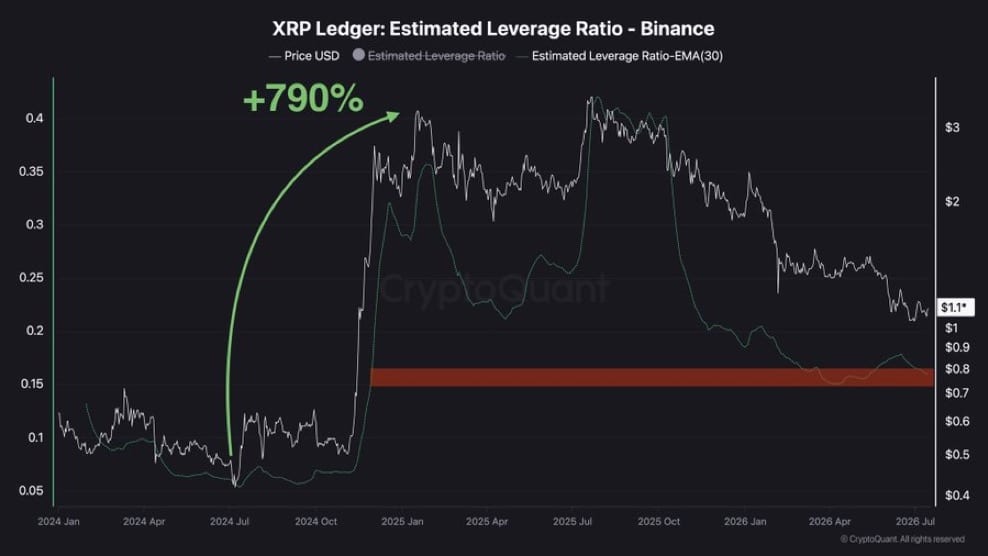
The flush gave way to a significant run that reached 790%. At press time, CryptoQuant data revealed $XRP entering a deleveraging phase once again.
Analysts, however, believe that this is neither a fractal nor a guaranteed sign that $XRP will rally.
Even so, $XRP’s Open Interest over the past year reflected this unwinding, falling from $10.94 billion to $2.39 billion for a decline of roughly 78%. This marked a clear outflow of leveraged capital worth about $8.55 billion from the market.
Are $XRP whales accumulating steadily?
While the leverage flush is no guarantee of a rally, on-chain data also tracked an interesting trend that could support the price overall.
Whales, the investors controlling a significant amount of capital, have come to dominate $XRP’s spot average order size. This seemed to imply that they are the most influential force in the market right now.
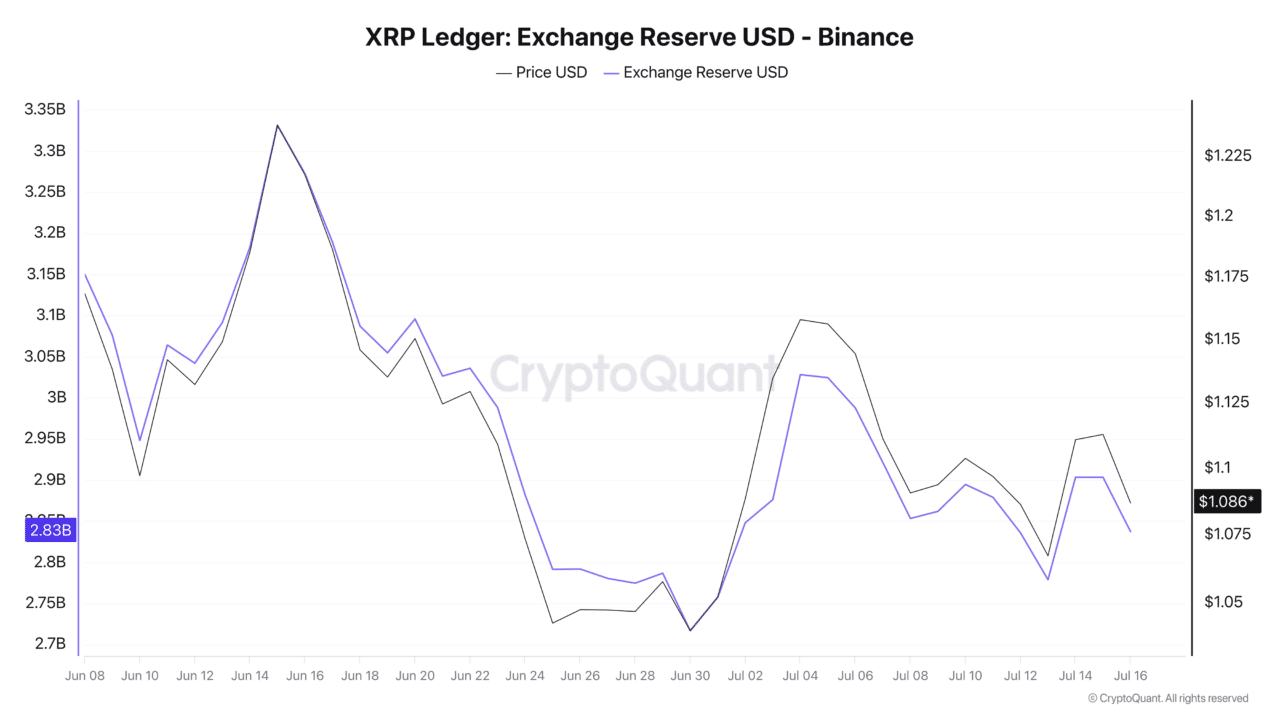
Exchange reserve data can give us clearer context to what this group has been doing though. The chart hinted at a fall in reserves, with the figure falling from 2.62 billion to 2.61 billion from 10 July.
In dollar value, roughly $57 million has flowed out of exchange balances into private wallets, moved by these whale wallets within the same period. A finding like that typically signals an ongoing but gradual accumulation of the asset, adding to its overall structure.
NVT ratio points to undervaluation
Finally, an analysis of the network value to transactions (NVT) data on the chart showed that $XRP may be presently undervalued.
The NVT ratio determines undervaluation or overvaluation by weighing market capitalisation against transaction volume in the market. When the ratio sits on the lower side of its historical range, it implies the asset is undervalued and has been oversold.
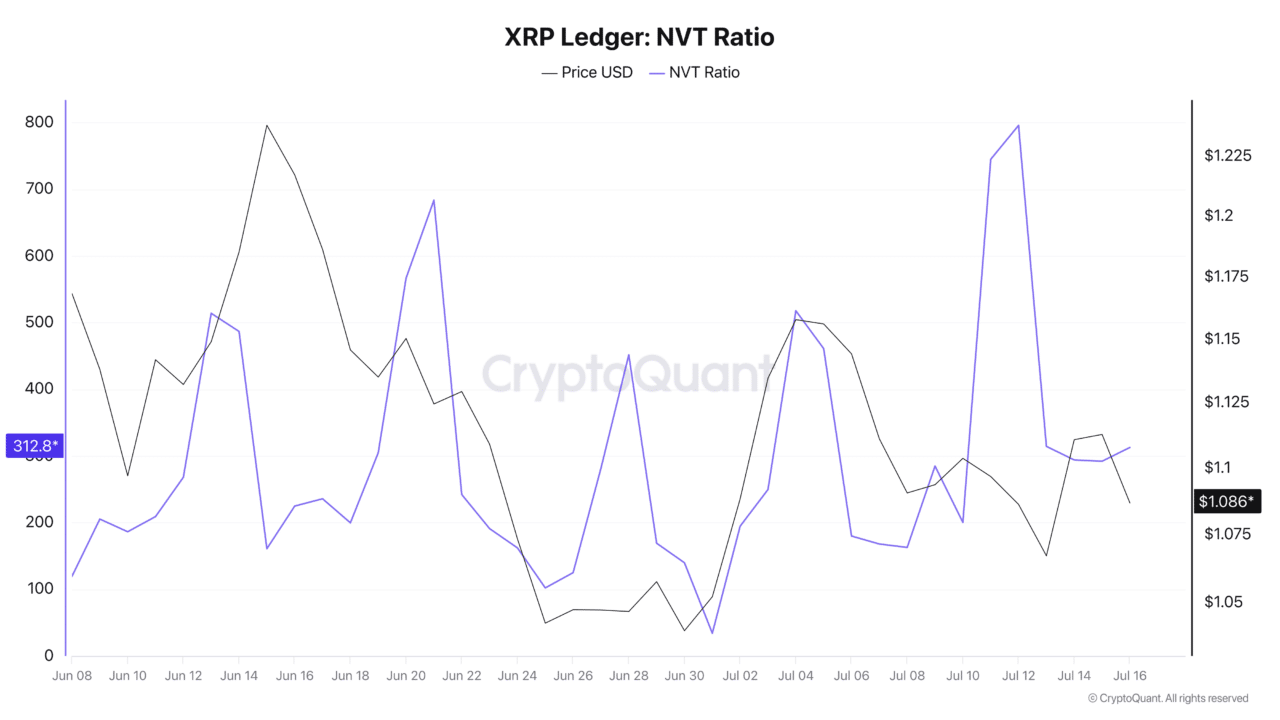
At the time of writing, the NVT ratio had a reading of 312.8, implying that network activity in terms of transactions has been minimal.
Until there is a clear uptick in the NVT, a high chance remains that the market stays undervalued. In fact, the reading is also evidence that whales may be purchasing $XRP when it is trading at a discount.
Final Summary
- $XRP now replicating the same market conditions that came before its 790% surge in 2024.
- Large investors are quietly buying and pulling $XRP off exchanges.