
After a protracted decline, Dogecoin is currently trading in a compressed low-volatility range; however, the notion of removing a zero in the upcoming week is realistically a stretch given the current structure.
Dogecoin's consolidation
With steady lower highs and robust rejection from important moving averages, the chart displays a distinct bearish trend that has persisted for months. As of right now, $DOGE is consolidating close to local lows while remaining slightly below the $0.10 mark.
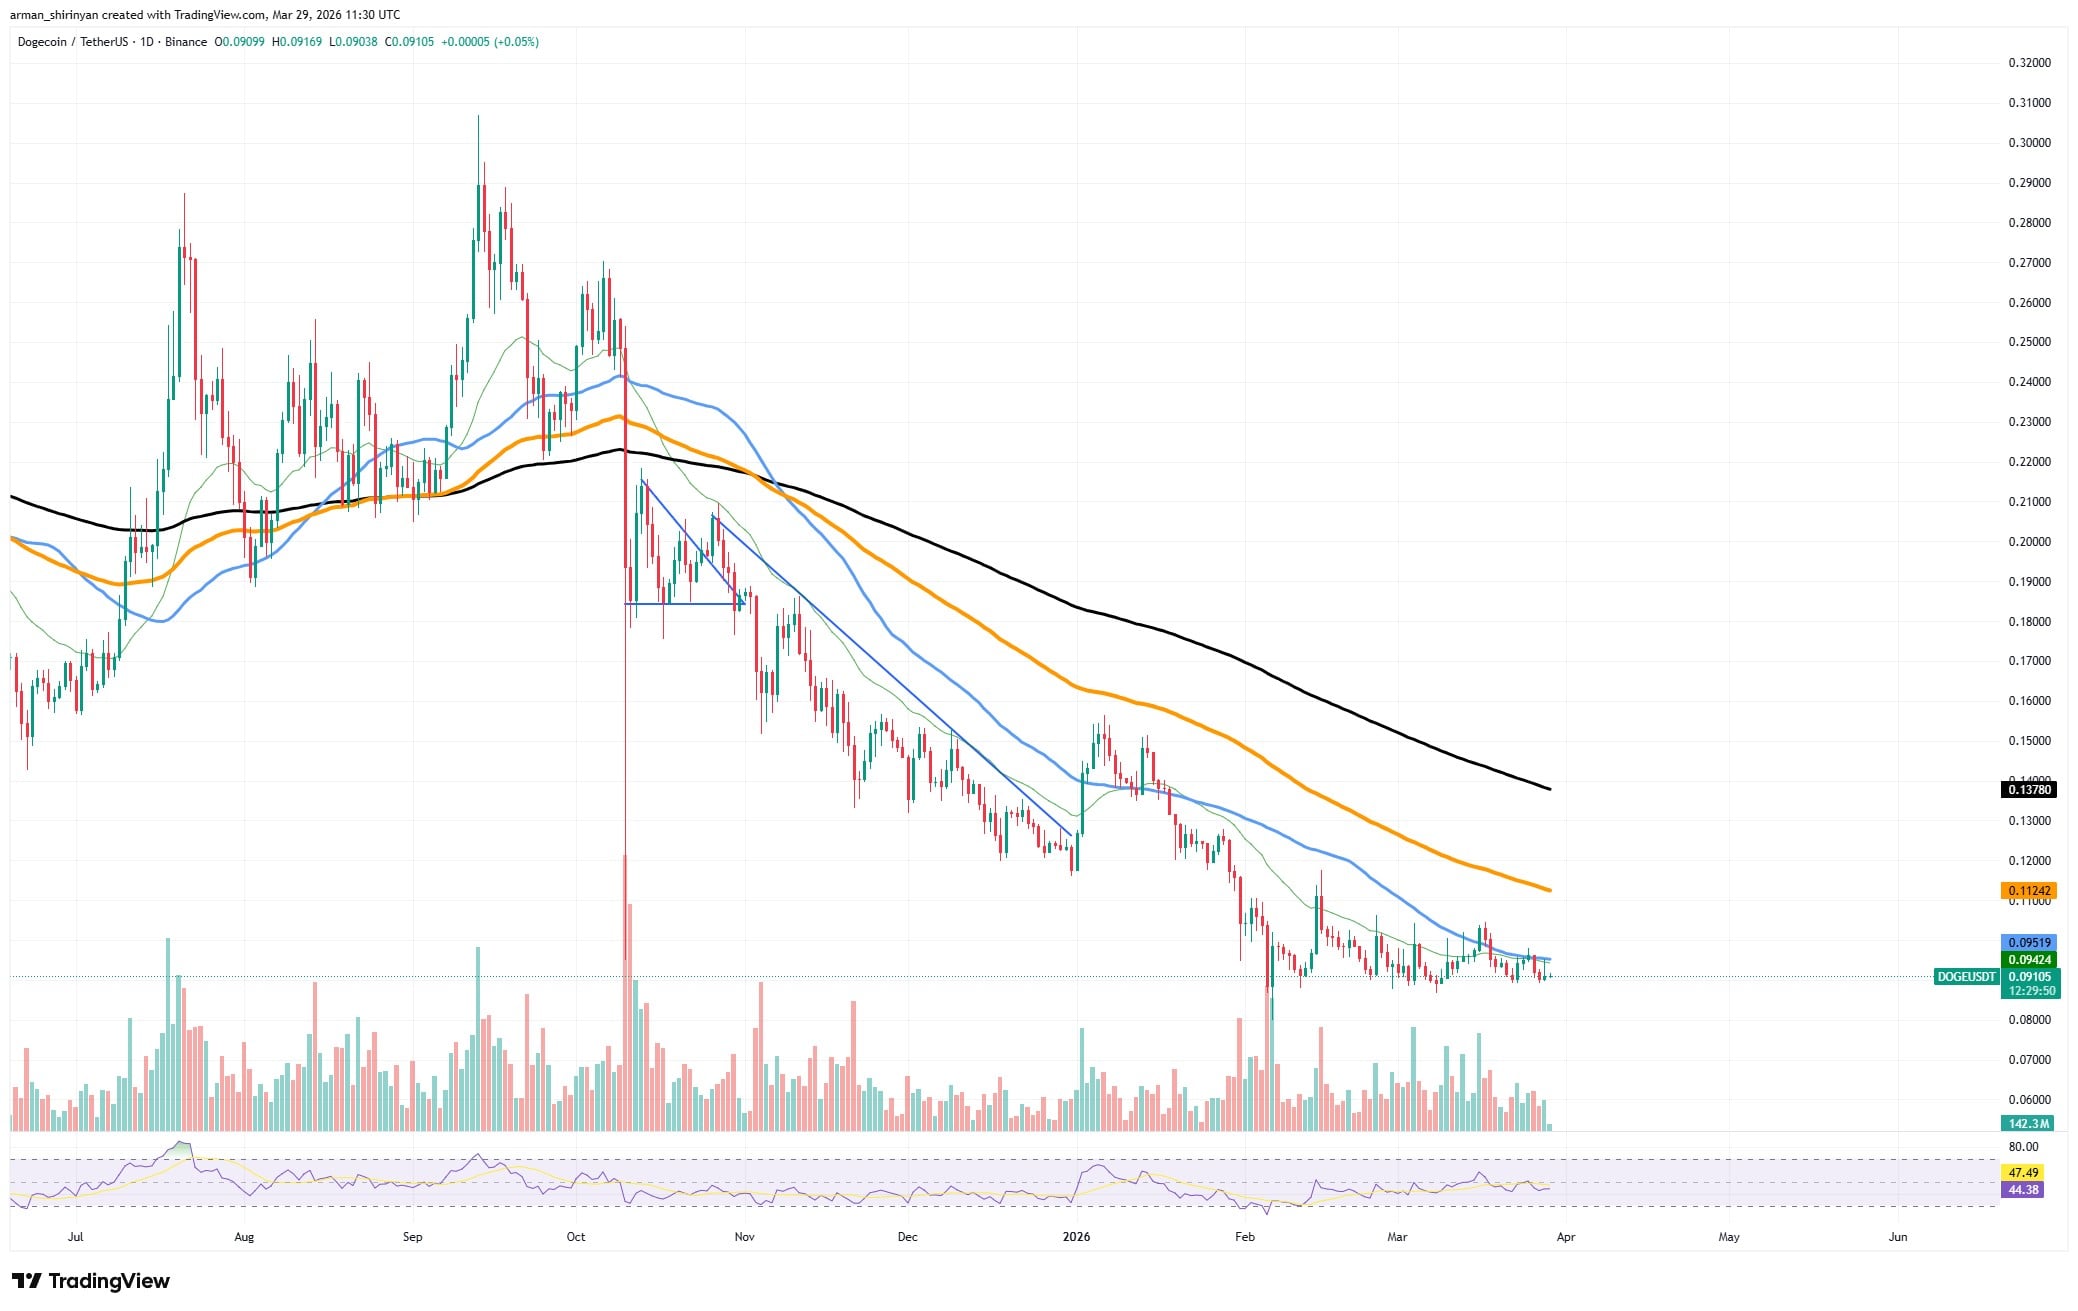
The price action has leveled off, creating a narrow sideways range with a small upward bias, but nothing approaching a breakout structure.
The asset is still below the 50, 100 and 200 EMAs, all of which are declining. That alignment is not a setup for a huge upside, but rather a traditional bearish continuation signal. Dogecoin would need to recover the $0.10-$0.11 range with significant volume before it could remove a zero and rise significantly.
First dynamic resistance
That region is in line with the 50 EMA, which has frequently served as dynamic resistance. Even if that level is broken, any short-term rally would probably be limited by the next barrier, which is located close to the 100 EMA at $0.13-$0.14.
In terms of momentum, the RSI is neutral, hovering around mid-range levels, which indicates hesitancy rather than growth. Additionally, volume has decreased, suggesting weak participation. $DOGE lacks the liquidity needed to initiate a long-term upward trend in the absence of a spike in buying pressure.
Nevertheless, there is one positive aspect: the downward trend is slowing. Consolidation has replaced the earlier sharp decline, which frequently precedes a bigger move. $DOGE may try a short-term relief rally if Bitcoin stabilizes and general market sentiment improves.
However, eliminating a zero would require a large percentage change, which is not immediately supported by the current configuration. Continued sideways movement or a slight bounce toward adjacent resistance levels are more realistic expectations.
$XRP is in new trading range
$XRP is approaching a critical inflection point that could redefine its short- to midterm trajectory. The asset is now trading dangerously close to its key support zone around the $1.30 level, a threshold that has consistently acted as the last line of defense against a deeper collapse. If this level fails, $XRP may enter what can only be described as a new pricing reality.
Technically, the structure remains firmly bearish. $XRP continues to print lower highs while being capped by descending trendlines and all major moving averages. The 50 and 100 EMAs are trending downward and positioned above price, reinforcing persistent selling pressure. Every attempt at recovery has been weak and short-lived, with sellers stepping in almost immediately at resistance levels.
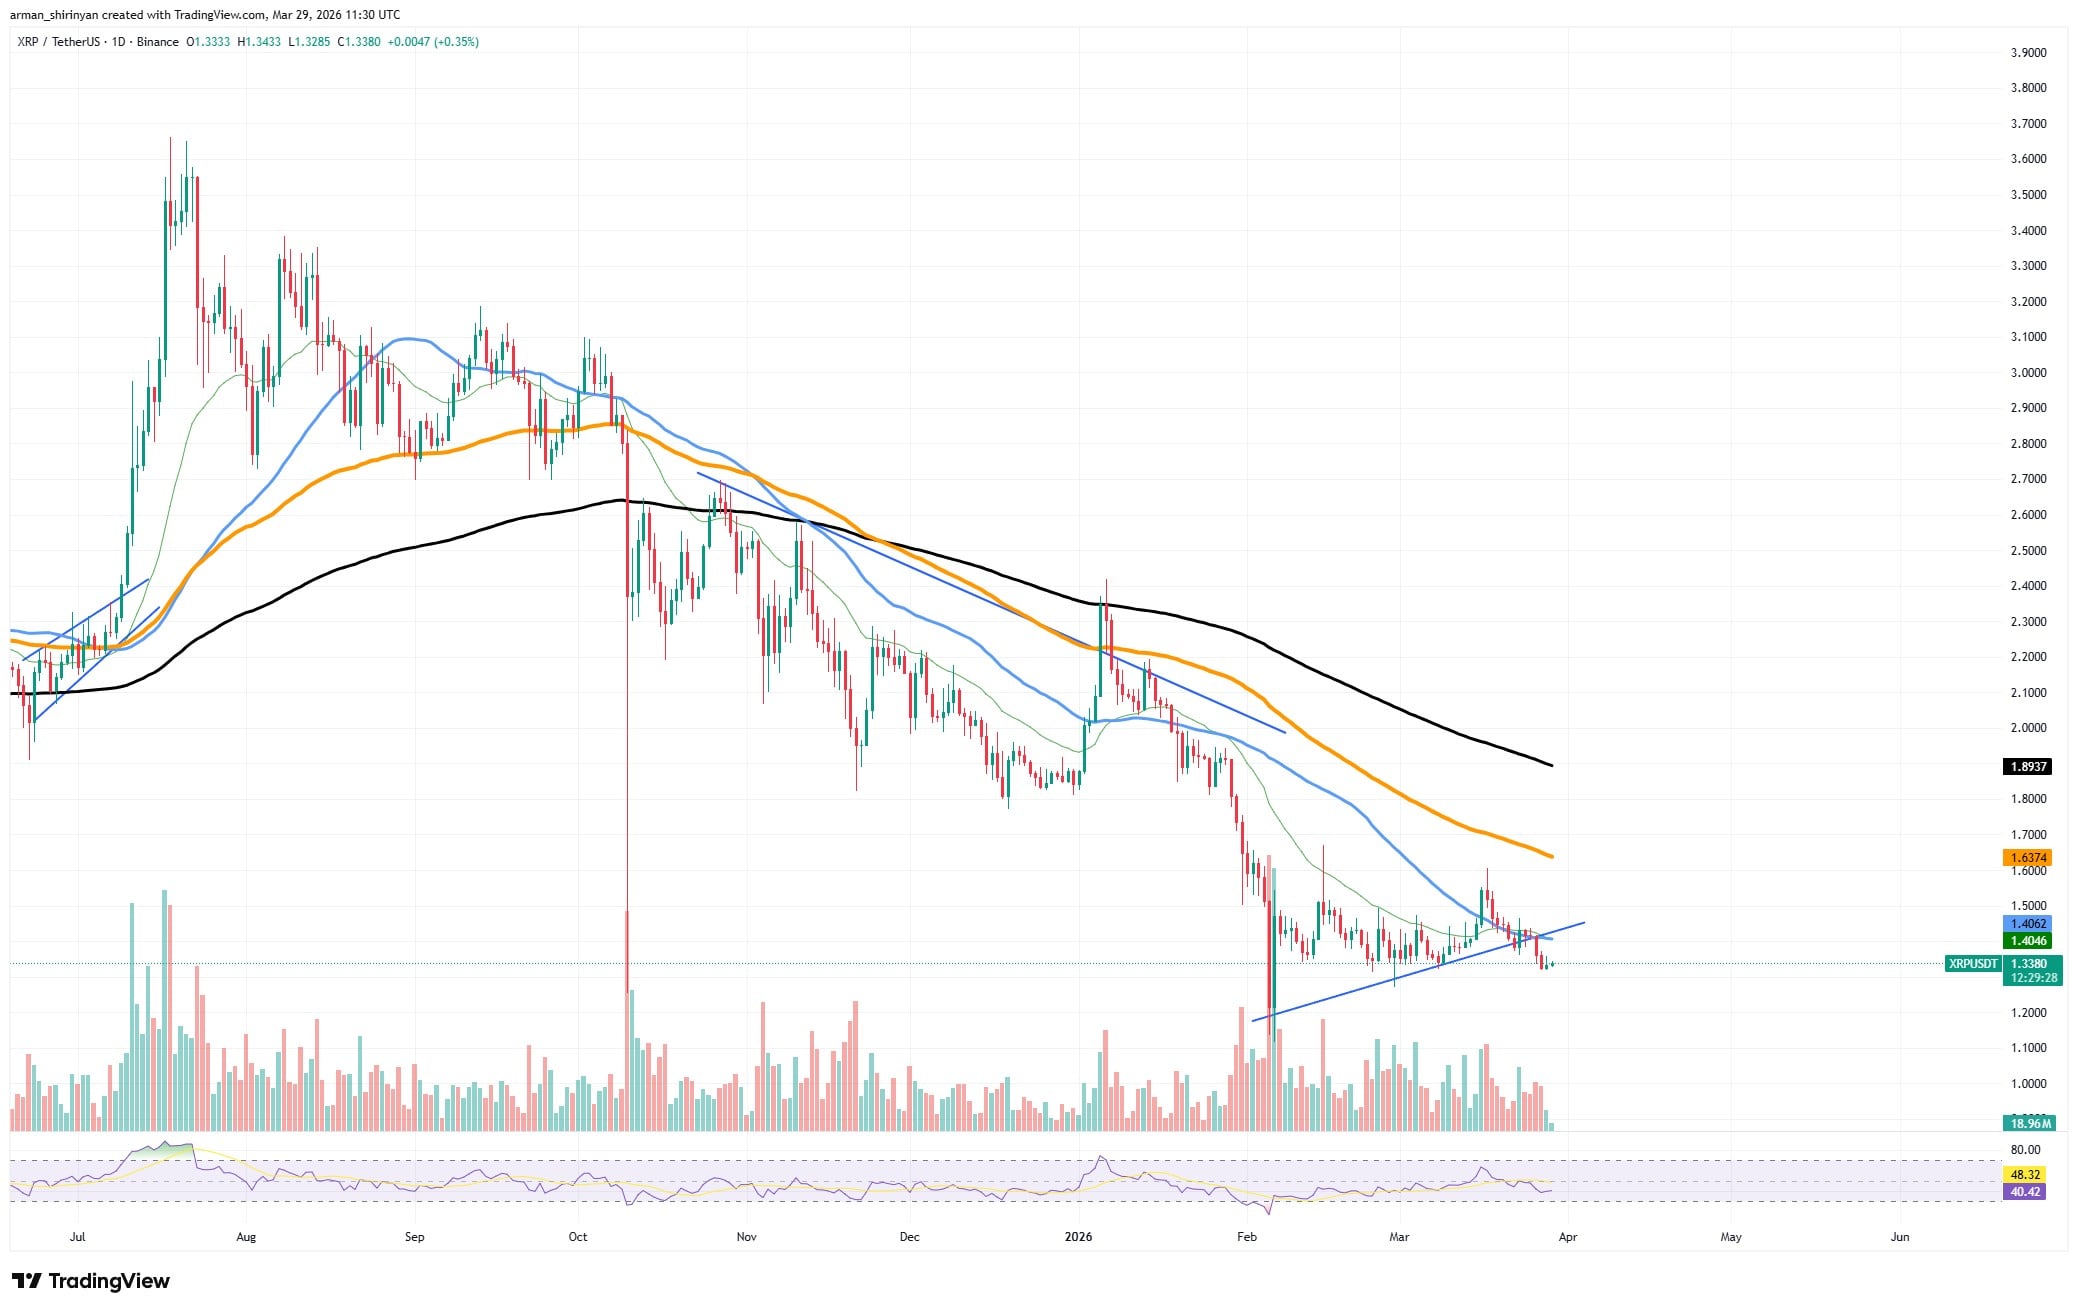
What makes the current situation more critical is the compression near support. $XRP has formed a weak ascending trendline from recent lows, but instead of building strength, price is now breaking below that structure.
Losing the $1.30 region would likely trigger a cascade of sell orders, opening the path toward the $1.20 zone and potentially lower levels that have not been tested in this cycle. At that point, market perception shifts. Instead of consolidation, $XRP would be viewed as continuing its macro downtrend with no immediate support nearby.
Momentum indicators are also not providing relief. RSI remains neutral to slightly bearish, offering no signs of bullish divergence or reversal buildup. This aligns with the broader picture of stagnation rather than recovery.
Shiba Inu's volatility phase is ending
Shiba Inu is entering a phase that typically precedes a decisive market move: volatility compression. The asset has been trading in an increasingly tight range, forming a small ascending structure near local lows while remaining under heavy macro bearish pressure. This kind of setup rarely lasts long.
From a structural standpoint, $SHIB is still in a downtrend. Price continues to sit below all major moving averages, with the 200-day trend acting as a distant ceiling and shorter-term EMAs sloping downward. However, what stands out now is not trend direction, but the shrinking price range.
Volatility stays up
Candles are getting smaller, wicks are tighter, and volume is gradually declining. That combination signals indecision and reduced participation, which is exactly what compression looks like before expansion.
The current formation resembles a weak ascending triangle, where buyers are attempting to push higher lows, but without enough strength to break overhead resistance. This is not a bullish structure on its own. It is neutral at best, especially given the dominant bearish context.
Compression phases build pressure. The longer price stays confined within a narrow range, the more aggressive the eventual move tends to be. In $SHIB’s case, the trigger will likely come from liquidity returning to the market.
The direction is still uncertain, but the conditions for a volatility surge are clearly forming. A breakout above the short-term resistance zone could initiate a relief rally toward the 50 EMA. On the other hand, a breakdown below the ascending support would likely accelerate the downtrend and push $SHIB into new local lows.