
Bitcoin is showing early signs that momentum may be shifting back in favor of buyers. $XRP is moving in an extremely dull sideways trend, while Solana is heading upwards for the first time in months. Unfortunately, though, the overall structure of the market leaves a lot to be desired.
Bitcoin sees structural change
The recent surge above $70,000 has altered the market's short-term structure following weeks of pressure and a protracted correction. This move is one of the most obvious indications that bullish activity is returning in recent weeks, even though the overall trend has not yet completely reversed.
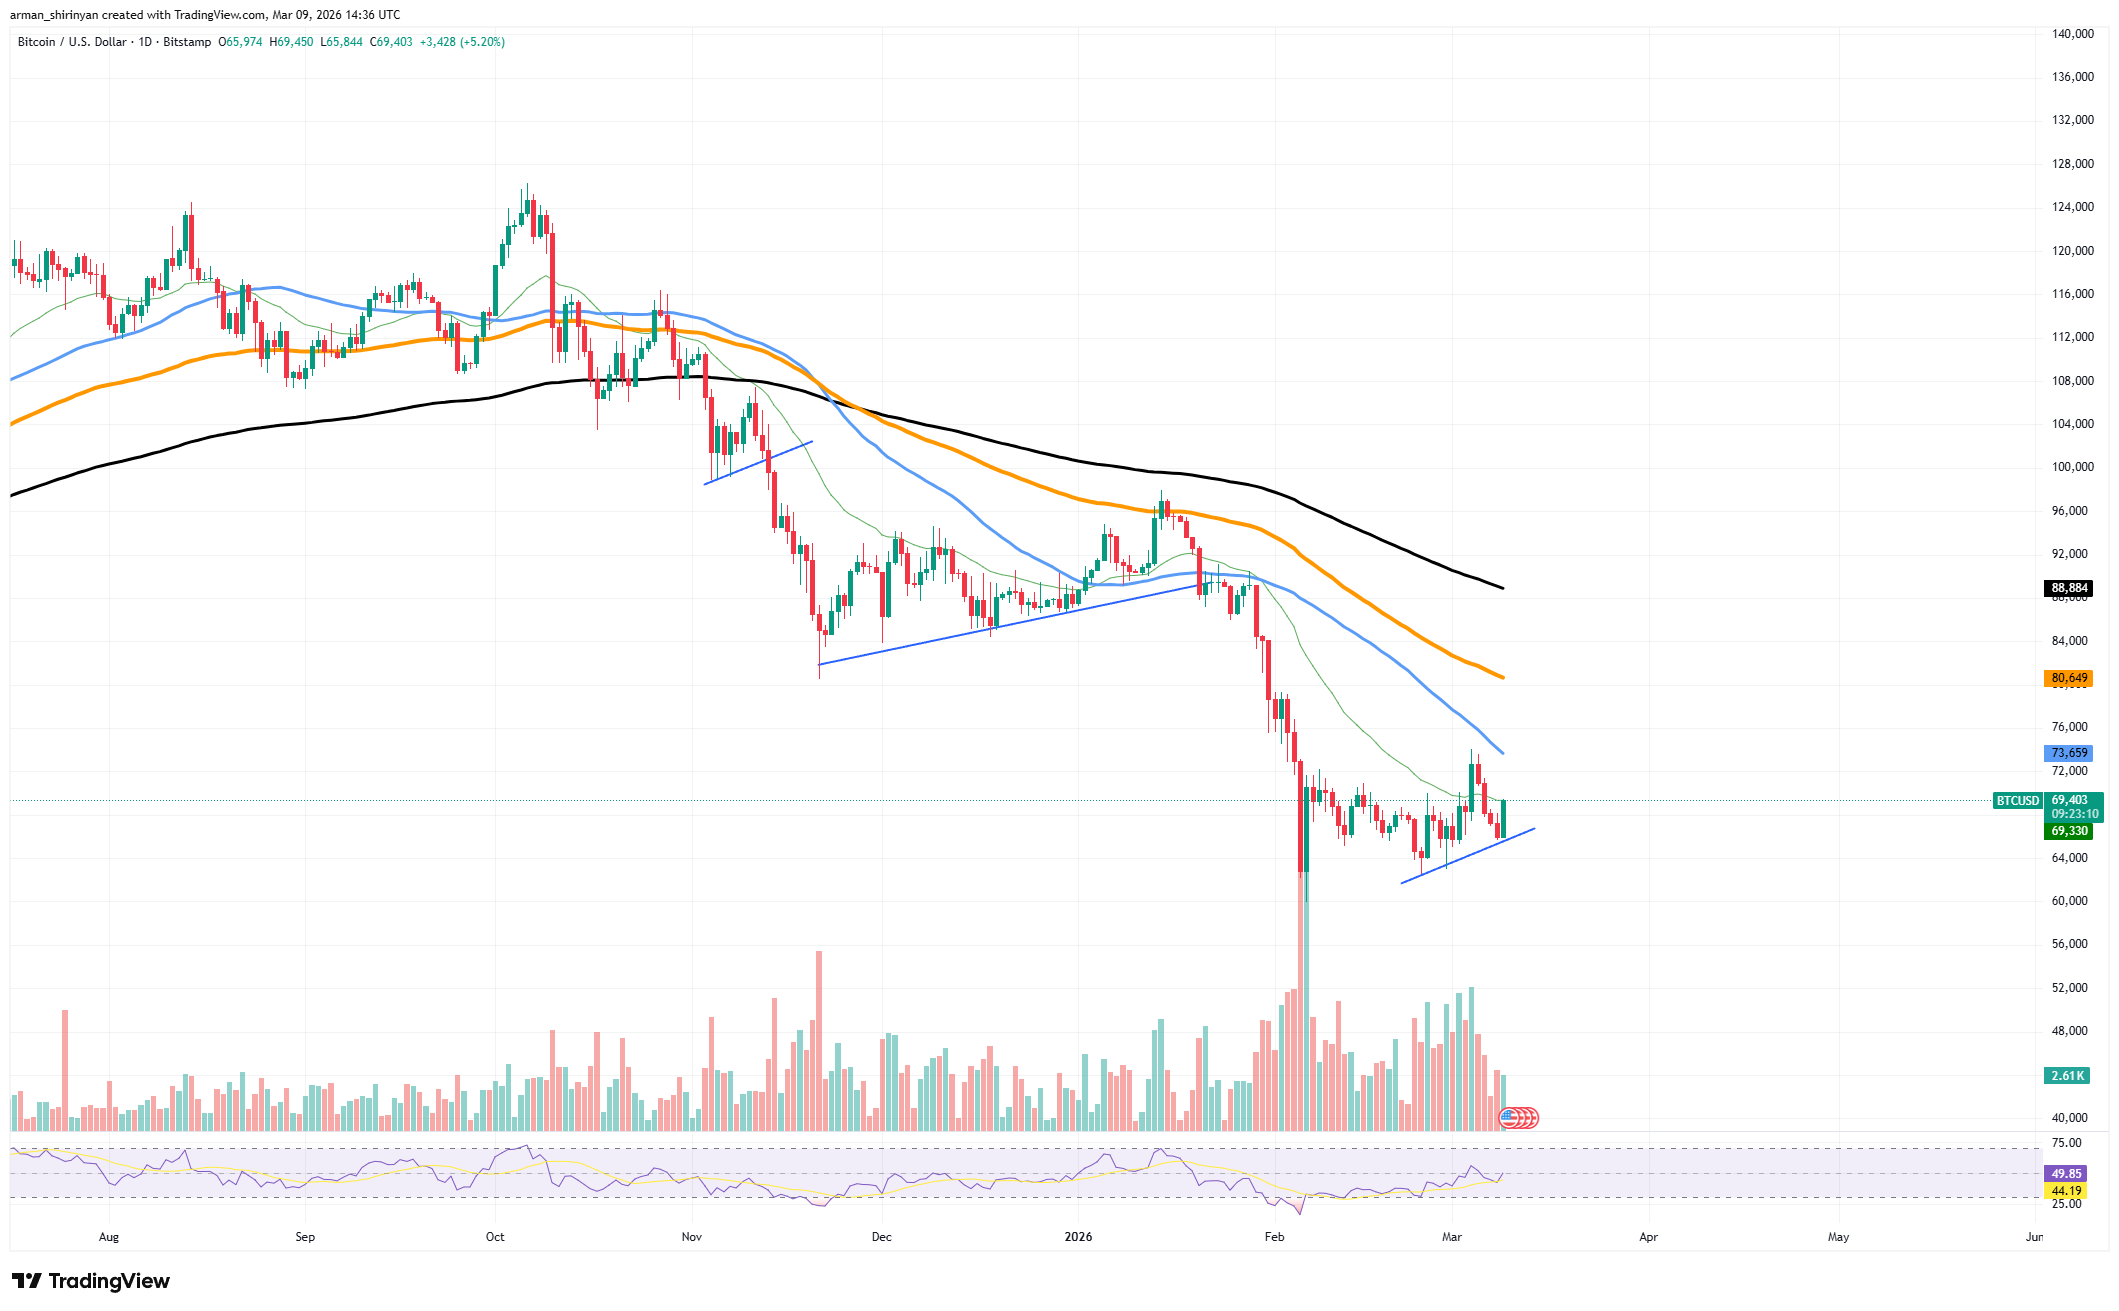
Since late January, the market has been clearly in a downward trend, with Bitcoin forming a number of lower highs and continuously falling below a number of significant moving averages. The asset moved toward the mid-$60,000 range in February as selling pressure increased, compelling traders to take a defensive posture. The market's mood remained cautious as the price repeatedly failed to maintain attempts at recovery.
Why $70,000 was important
However, the recent rebound slightly changed the picture. The $70,000 resistance level, which had previously served as a temporary ceiling during the consolidation phase, was successfully breached by Bitcoin. After a significant correction earlier in the quarter, this move implies that buyers are starting to regain control.
In technical terms, a growing support structure also occurs at the same time as the breakout. Bitcoin has been printing higher lows, creating a rising support line that shows demand is progressively increasing below the price. Buyers have been drawn to each dip toward the mid-$60,000 range, keeping the market from returning to earlier deeper lows.
The improvement in market momentum indicators is another positive factor. Relative strength has started to rebound from oversold territory, which frequently happens when selling pressure starts to wane. The most recent rebound also saw an increase in volume activity, indicating that meaningful participation rather than thin liquidity supported the move.
Nevertheless, there are still challenges facing the market. Many significant moving averages are still above the price, especially in the $73,000-$80,000 range, where Bitcoin previously faced significant resistance. A stronger trend reversal would be confirmed by a sustained move through this area.
Solana wakes up again
Solana has started a slight but discernible upward trend after several months of declining price action. Even though this change is slight in comparison to the powerful rallies that occurred earlier in the cycle, it nevertheless signifies a significant increase in short-term momentum.
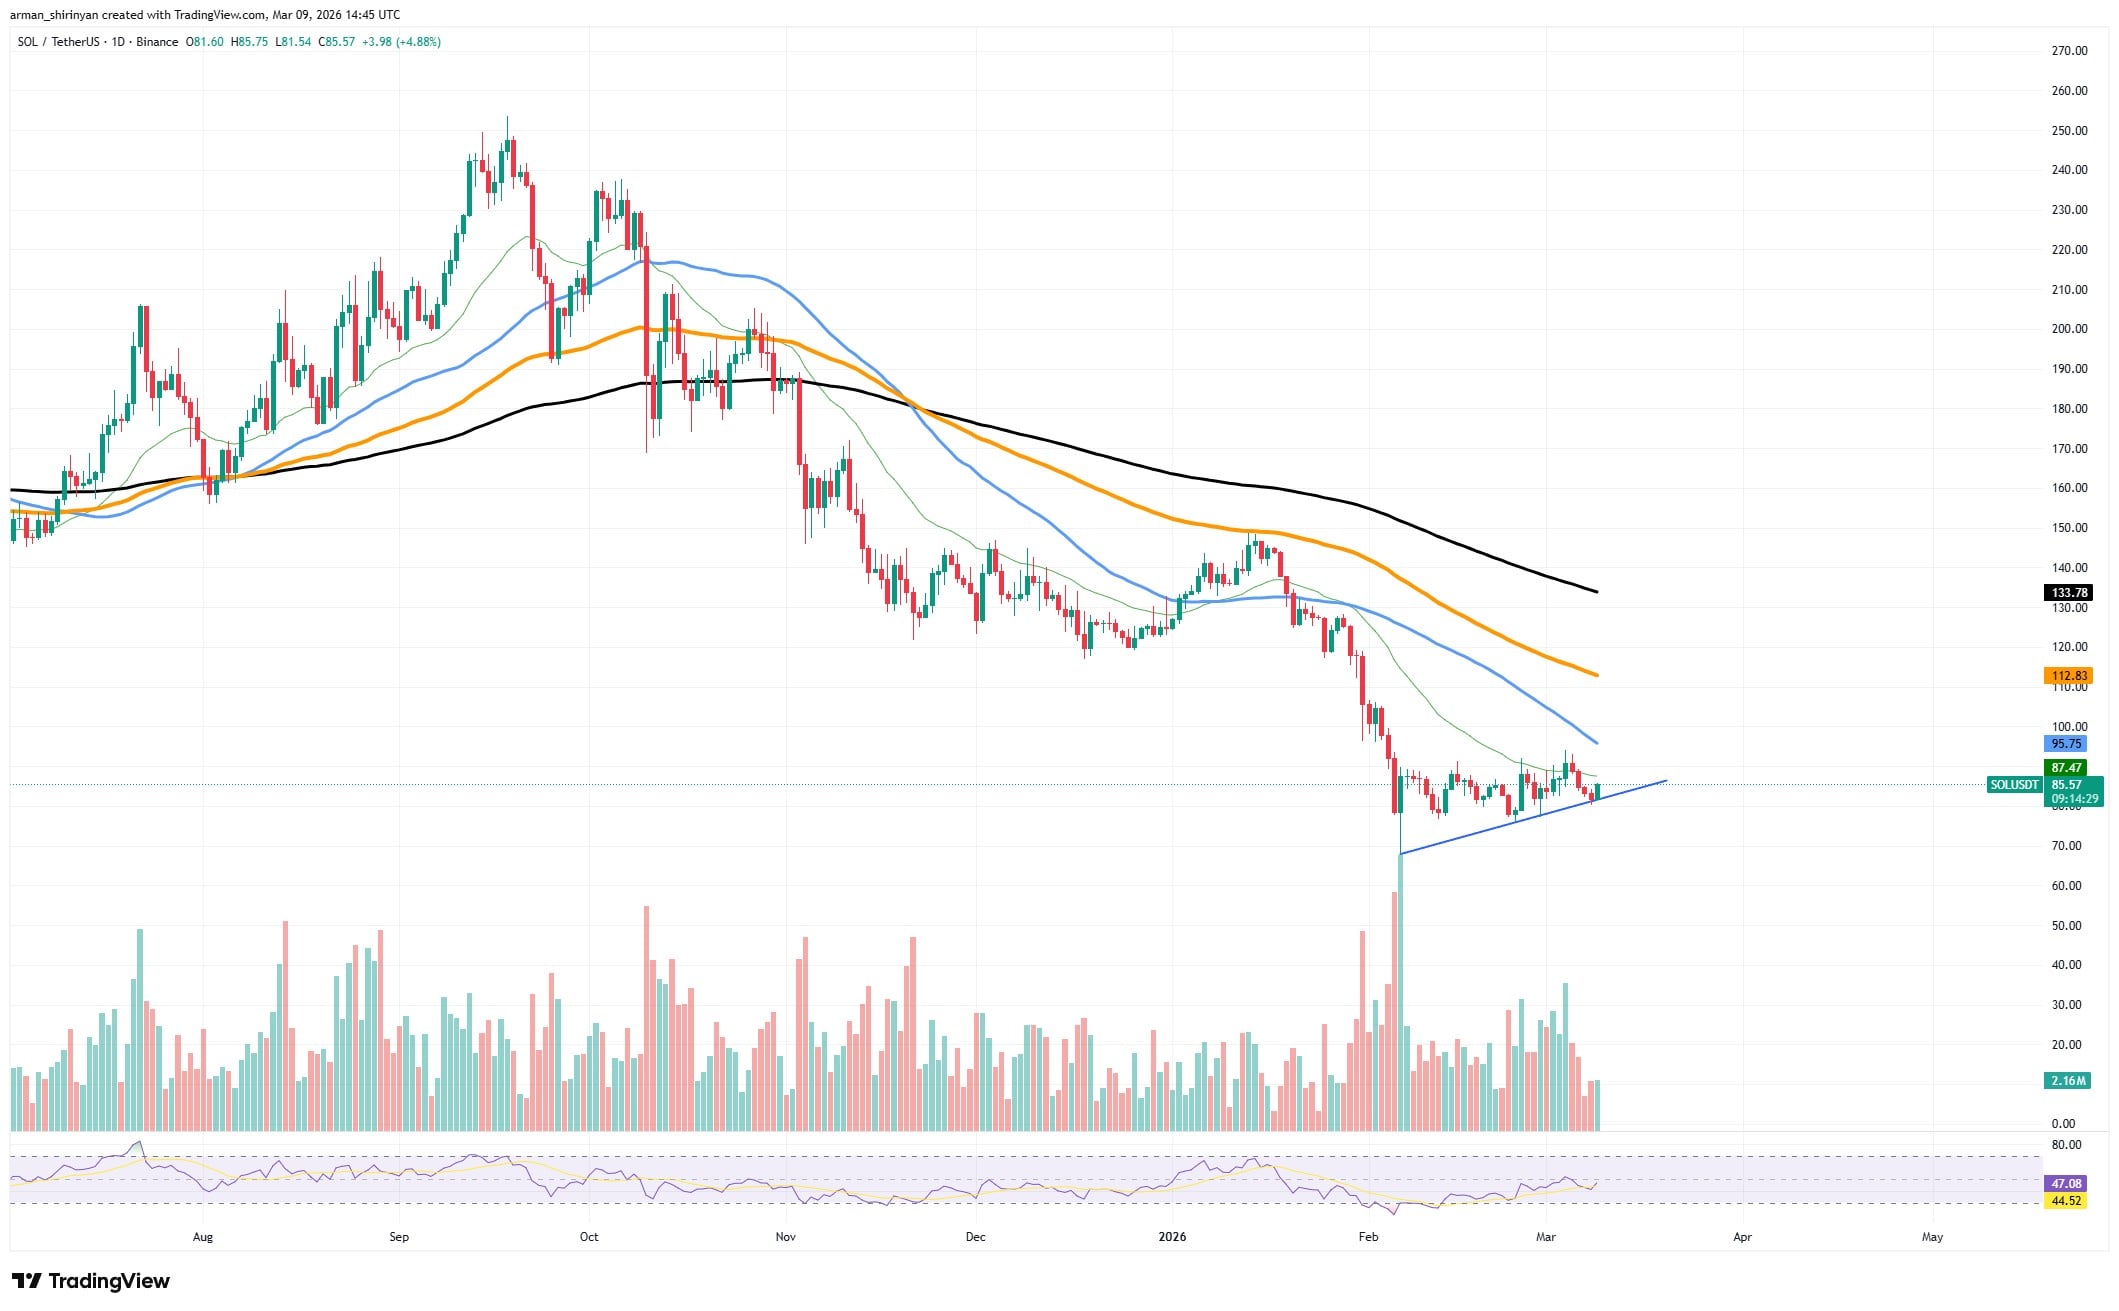
Solana has begun to form higher lows on the daily chart, resulting in a rising support structure that presently keeps the price above the $80 mark. Buyers are gradually returning to the market, as indicated by this steady upward slope. The asset is able to create a tiny upward channel because each pullback is absorbed at a slightly higher rate than the one before it.
It is not an explosive move. Rather, Solana is rising slowly and steadily, which is the type of price behavior that frequently emerges in the early phases of stabilization following a significant correction.
What fueled demand?
The asset has been working to rebuild its structure around the mid-$80 range, where demand has begun to emerge since the steep decline earlier in the quarter. The path to the $95 level, which is clearly the next significant technical goal, has been made possible by this emerging mini-trend.
The 50-day exponential moving average, which is presently centered on that region, gives this level its significance. Reaching that level would be the first significant test of Solana's recovery attempt because moving averages frequently function as dynamic resistance during downtrends.
A move toward $95 would show that the market can maintain upward momentum once more, but it would not necessarily indicate a complete trend reversal. Breaking through the 50 EMA could then open the door to a broader recovery phase, especially if overall market sentiment improves alongside Bitcoin and the rest of the crypto sector.
A gradual return of interest is also suggested by volume behavior during the recent rebound. During upward movements, trading activity has increased, suggesting that genuine participation rather than poor liquidity is driving the current ascent.
$XRP under control
Although $XRP is presently trading in the $1.30-$1.35 range, the asset's overall technical picture is still unfavorable for the market.
$XRP is still having trouble regaining its upward momentum after several months of declining price action. With few indications of stabilization, the chart's structure indicates that sellers are still in complete control of the market.
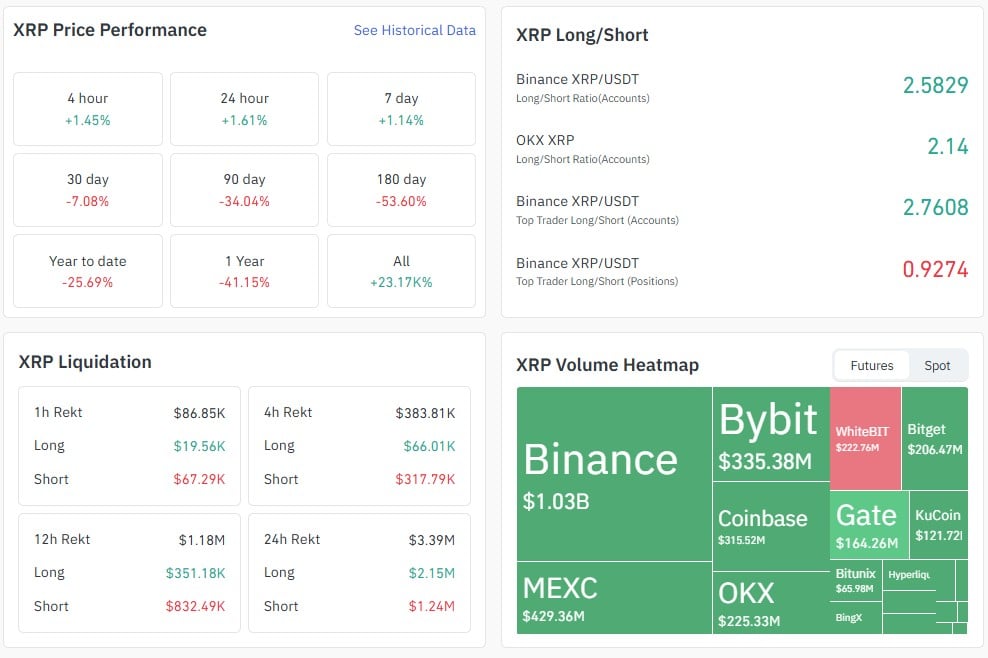
One of the most obvious problems is the persistent downtrend structure. Since late 2025, $XRP has been making lower highs and lower lows, which is the most obvious sign of a bearish market. Every attempt at a recovery has been short-lived, encountering opposition fast and driving the asset back down. Even the most recent consolidation above the rising support line seems brittle rather than solid.
The major moving averages' positions are another worrying factor. The price is still much higher than the 50-, 100- and 200-day trend indicators. The general bearish momentum is being reinforced by the downward slope of these moving averages.
The price of $XRP would first need to overcome a number of resistance layers between about $1.40 and $1.80 in order to make a significant recovery. The asset is still technically trapped under extreme pressure until that occurs.
The technical picture is also reflected in market sentiment. While the overall trend is still negative, traders seem reluctant to commit to aggressive long positions. Because of this, $XRP is presently trapped in a small consolidation range that is only marginally higher than recent local lows.