
Following weeks of diminishing momentum, XRP now looks perilously close to a complete breakdown, with the $2.00 mark now serving as its next reasonable target. The asset's recent inability to regain important moving averages presents a dismal short-term picture, indicating that the recovery attempt earlier this month has probably reached its limit.
XRP's breakdown around the corner
XRP has clearly lost its 200-day moving average on the daily chart, which has traditionally served as a foundation for long-term trend support. At the moment, the price is circling around $2.40, and there is not much buying pressure. Compared to the ferocious summer rally, volumes have significantly decreased, and momentum indicators like the RSI (41.7) are still pointing lower, indicating a persistently bearish outlook.
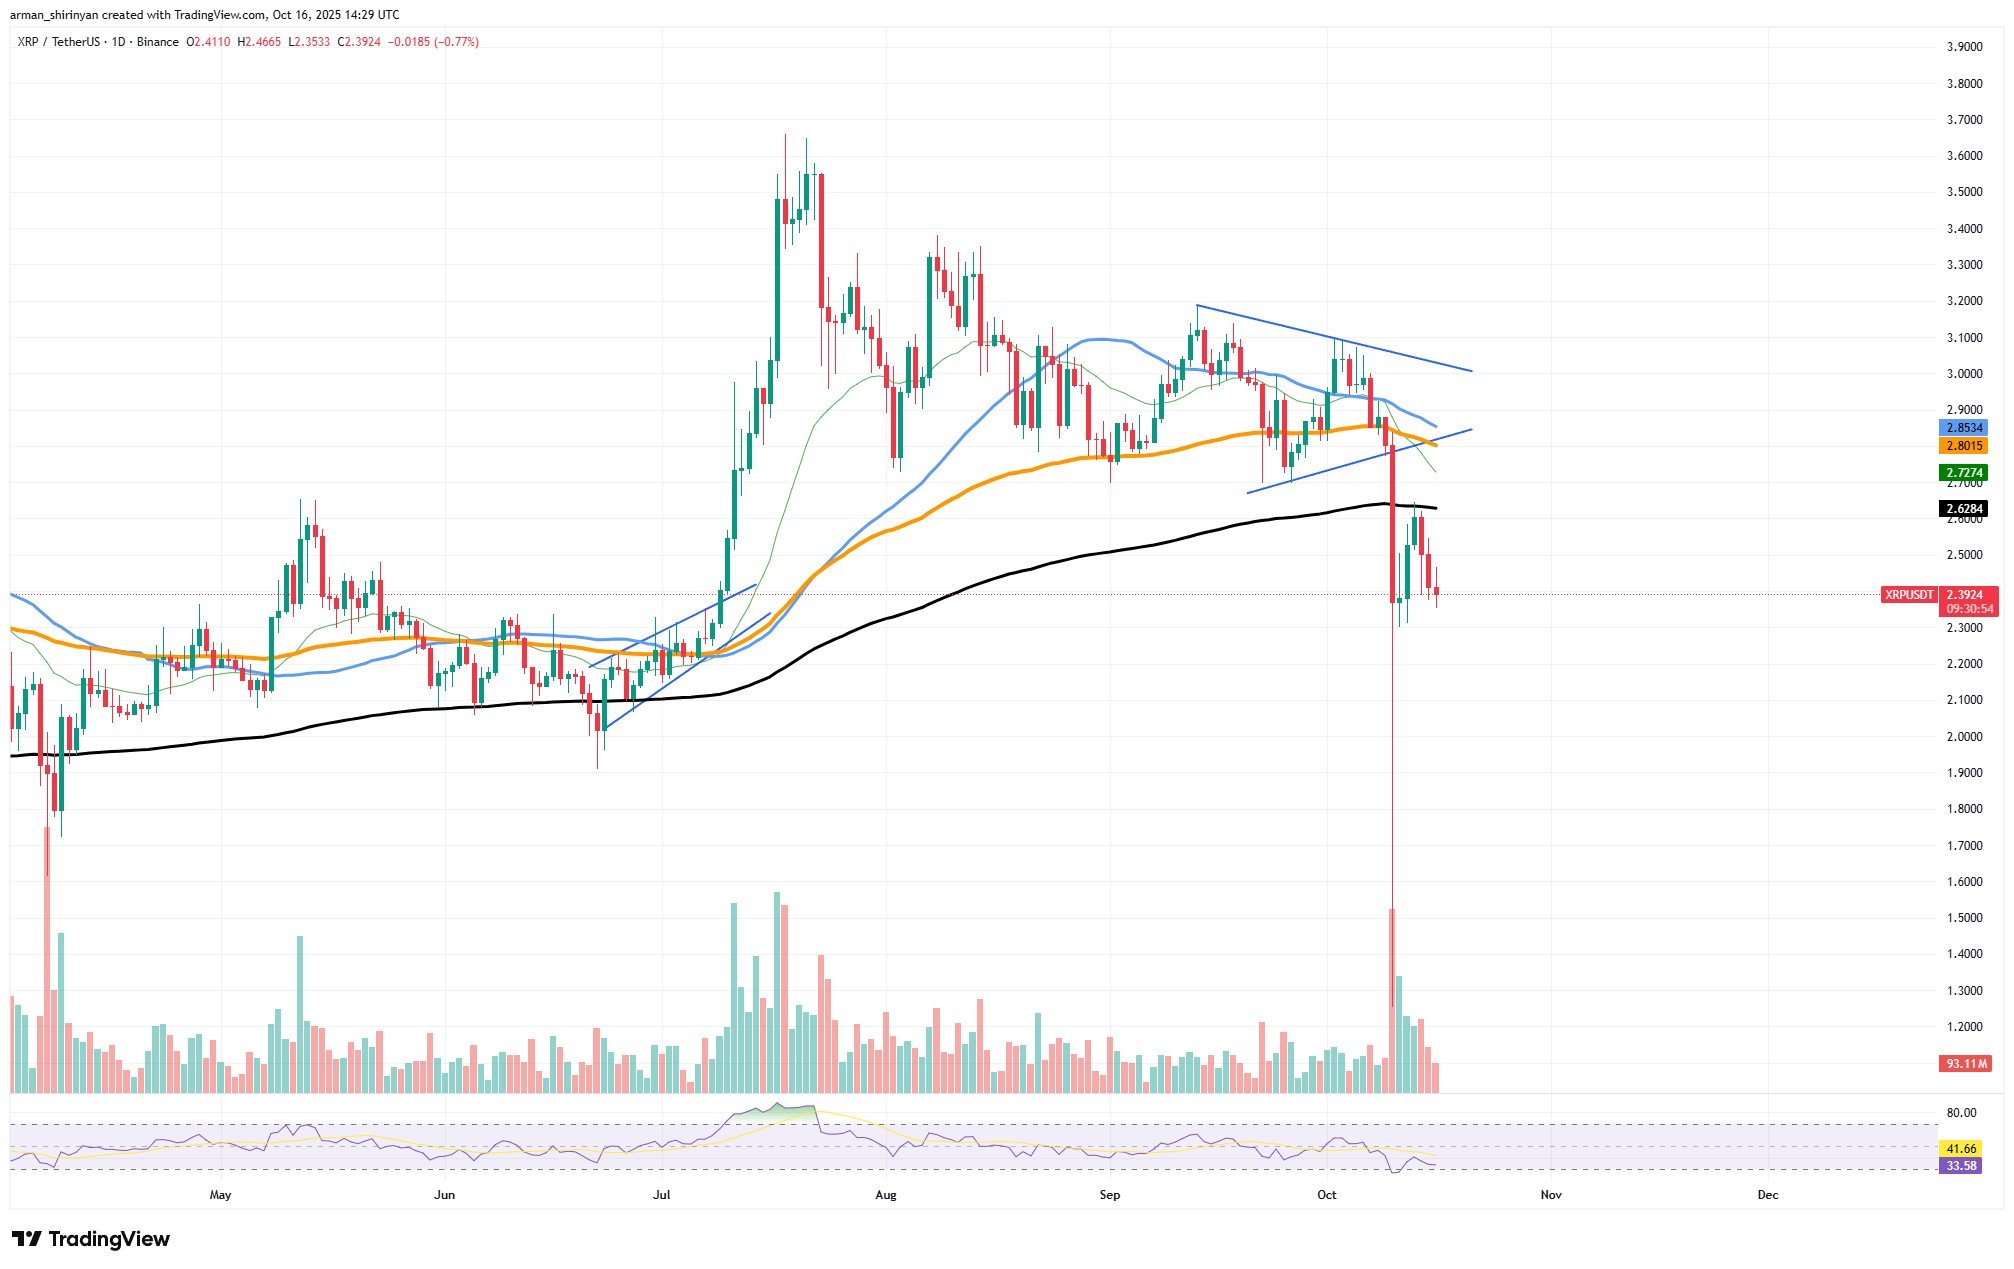
Because of its structural lock in a descending channel, XRP continuously rejects breakout attempts at lower highs. The upper trendline was reaffirmed by the most recent rejection around $2.85, and the recent flush below $2.30 demonstrated that sellers are still in firm control. It is most likely that the market will decline toward $2.00, which is also the lower channel boundary and a historical accumulation zone from early May, if the current support at $2.35-$2.40 fails.
XRP’s midyear bullish structure would be essentially invalidated if it broke below $2.00. This could lead to deeper retracement levels, possibly around $1.80-$1.70, where previous consolidation occurred. This risk is further supported by the declining volume profile, which demonstrates that supply is being dumped onto the market at a rate that is simply outpacing demand.
The bias will remain bearish unless buyers act decisively and push XRP back above $2.70. As of right now, the chart exhibits every sign of a market that has lost its trend. If sentiment does not change quickly, XRP’s next big move could actually be a test or even a breach of that psychological $2 floor.
Shiba Inu's stabilization
After weeks of gains were erased by a vicious sell-off, Shiba Inu (SHIB) might be beginning to stabilize and possibly form a recovery base. Although the market as a whole is still cautious, traders hoping for a recovery before the token loses the crucial $0.0000100 support have some hope thanks to SHIB’s technical setup and recent price behavior.
On the daily chart, SHIB broke a multimonth consolidation pattern when its sharp decline earlier this month forced it below the 100-day and 200-day moving averages. The token has since stabilized around $0.0000103, though, and repeated attempts to reclaim $0.0000105-$0.0000106 indicate that sellers might be losing ground. With the RSI at about 40, SHIB is getting close to oversold territory, which is usually a sign of impending short-term reversals.
The cautious optimism is reinforced by the fact that trading volume has leveled off after a capitulation spike, which frequently signals seller exhaustion. The chart’s descending wedge structure, which shows stronger supply walls around $0.0000122-$0.0000125 and immediate resistance near $0.0000116, also suggests a possible bullish breakout if momentum returns.
In terms of psychology, the $0.0000100 zone is a crucial threshold. The foundation for a recovery rally may be set in the upcoming weeks if SHIB is able to maintain above the current level and set a higher low. If this level is not defended, downside risk could reopen toward $0.0000090, which is the next important accumulation range.
Shiba Inu’s outlook is still precarious but not dire. The recent stabilization and waning selling pressure could provide the foundation for a short-term reversal. It would probably be confirmed by a push above $0.0000115, giving traders one last sincere hope for a recovery before the $0.00001 threshold is tested once more.
Ethereum drained
The price action of Ethereum right now presents a bleak picture of fatigue, uncertainty and waning momentum. With ETH hovering just below $4,000, it is having difficulty regaining the strength it showed earlier this year. The asset now appears desperate to hold important technical levels before plunging further into a possible midterm correction following months of higher highs and robust institutional inflows.
Ethereum is no longer in the lead structurally. Its symmetrical triangle breakdown in late September initiated a bearish trend that has not been effectively stopped yet. While holding onto support close to the 200-day EMA at about $3,500, the price is trapped between two critical moving averages: below the 50-day and 100-day EMAs. When bulls can no longer push back with significant volume, that dynamic frequently indicates market exhaustion.
This weakness is reinforced by volume alone. Significantly lower participation accompanied the recent attempts to recover off the $3,800-$3,900 zone, suggesting that accumulation is deficient. RSI levels close to 43 indicate that there is some overselling but no buyer conviction, indicating that sentiment is still neutral to bearish rather than opportunistic.
For Ethereum, narrative fatigue is the greater issue. However, ETH’s ecosystem has not produced a new catalyst that can generate momentum, even though Bitcoin has regained investor attention amid macro headlines and ETF chatter. On-chain activity is still low, and significant advancements in scaling and restaking alone will not spark speculative demand.
In the short term, ETH could be stuck in a sideways-to-downward channel for the remainder of Q4 unless it regains $4,250-$4,300. The capitulation cycle could be accelerated if the price falls below $3,800, which would lead to a test of $3,500. Ethereum’s desperation is evident for the time being. The asset is not collapsing, but it is clearly gasping for a reason to rally, and none seems to be on the horizon yet.