 By cryptoadmin
 Audiera [$BEAT] has attracted enough capital inflow to push its valuation sharply higher, with market capitalization up 17% and the asset worth roughly $970 million at the time of this analysis.
That performance heading into the weekend leaves one question open—whether the rally survives into the new week. Several factors argue for continuation, and a handful of risks sit directly against them.
$BEAT chart points to unfinished upside
The 4-hour chart suggests $BEAT has more room ahead of it than the current move implies, and the case rests on the pattern the asset has just exited.
$BEAT broke out of an ascending triangle, a structure which typically precedes an extended rally, with the measured move often carrying price back toward the point where the consolidation first began.
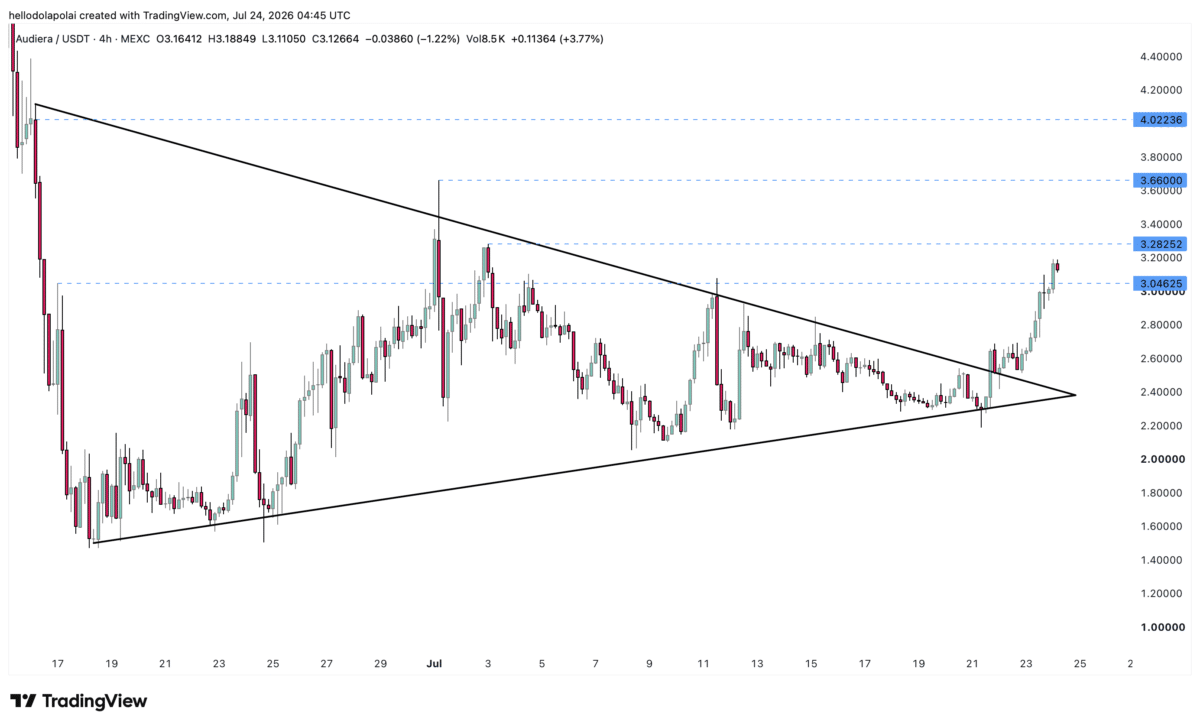
Applied here, the extension puts $BEAT on course for $4.0, returning the asset to territory it held before the consolidation set in.
The route there is far from clean, since two levels stand between $BEAT and that target. The asset must first absorb supply at $3.2, then clear $3.6, before the final objective comes into play.
Momentum currently supports the attempt, with volume confirming the move higher, up 82% at $32.87 million, according to CoinMarketCap.
Liquidation heatmap keeps pressure on
The rally carries pressure of its own, and the liquidation heatmap explains why the upside case arrives with a caveat.
Clusters sit both above and below the current price, marking where sell and buy orders concentrate. Those above give $BEAT a target to chase while momentum holds, though they thin out quickly and cap how far the swing can extend.

The heavier risk sits underneath, where the liquidity clusters run denser and stretch farther below spot. Clusters of that size act as a magnet, and they can pull $BEAT toward them once the upward push fades, accelerating any decline.
Positioning still leans bullish for now, with traders betting on a drop losing roughly $488,910 over the period against $98,510 lost by traders positioned long.
Indicators point $BEAT away from a near-term drop
$BEAT looks more likely to defy a short-term decline given the direction its momentum indicators point.
The Moving Average Convergence Divergence reading shows bullish momentum building, with the MACD line—the difference between the 12- and 26-period EMAs—crossing above its signal line for the first time since early July.
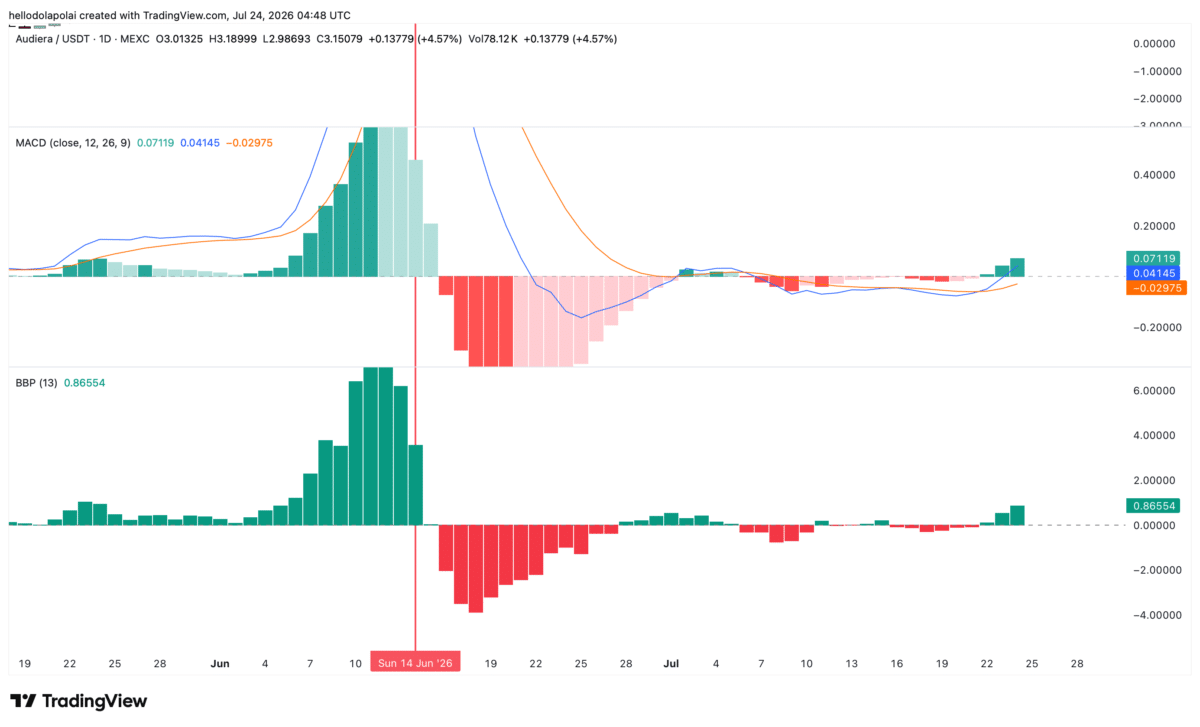
Bull Bear Power reinforces the picture, showing bulls have stepped back into the market with the strongest reading since 14 June. That strength suggests buyers can defend current levels and hold price above them longer than the present trade implies.
Final Summary
- $BEAT’s ascending triangle breakout on the 4-hour chart projects a move toward $4, though $3.2 and $3.6 resistance stand in the way first.
- Liquidation clusters run denser below spot than above, leaving $BEAT exposed to a sharp pullback once buying momentum thins out.