Cryptocurrency trading on Binance can be both exciting and daunting for beginners. But fret not; we’ve got your back. One of the essential skills you need to acquire is the ability to read cryptocurrency charts. Charts are your trusty compass in the tumultuous crypto seas, helping you navigate and make informed trading decisions. In this comprehensive guide, we’ll dissect the intricacies of Binance charts, empowering you to become a savvy and confident trader.
Types of Charts on Binance
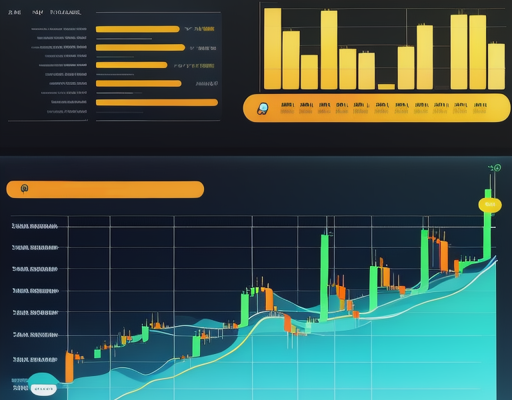
Binance.com offers an array of chart types, including candlestick charts, line charts, and bar charts. Among these, candlestick charts reign supreme. Why? Because they provide a wealth of information about price movements, making them the go-to tool for technical analysis.
Deciphering a Candlestick Chart
Candlestick charts are composed of, you guessed it, candlesticks! Each candlestick represents a specific time period (e.g., 1 minute, 5 minutes, 1 hour, 1 day, etc.) and consists of three vital components:
1. The Candlestick Body
This is the rectangular region between the opening and closing prices. When the body is shaded, it signifies that the closing price was lower than the opening price, earning it the nickname “bearish” or “minus” candle. Conversely, an unshaded body means the close price was higher than the open price, making it a “bullish” or “plus” candle.
2. The Upper and Lower Shadows
Thin lines extending from the candlestick body are the upper and lower shadows. They reveal the highest and lowest prices during the given time period. These shadows are like whispers from the market, divulging crucial insights into volatility and price fluctuations.
Time Intervals: Choosing Wisely
Binance caters to traders with various time intervals for chart display, including 1 minute, 5 minutes, 15 minutes, 1 hour, and 1 day. Picking the right interval is paramount, as it directly impacts your analysis and decision-making. Short-term intervals like 1 or 5 minutes are ideal for quick trades, while long-term intervals like 1 day or 1 week suit investors eyeing the bigger picture.
Indicators and Analysis Tools: Your Arsenal
Binance doesn’t stop at charts; it offers a treasure trove of indicators and analysis tools. Some crowd favorites include moving averages, stochastic oscillators, and relative strength indicators. These tools are your sidekicks, helping you identify trends, support and resistance levels, and other signals crucial for your trading decisions.
Zooming Out: The Big Picture
When you’re deep into chart analysis, it’s easy to lose sight of the forest for the trees. Remember, the overall market situation matters. This involves scrutinizing trading volume, staying updated on news and market events, diving into fundamental analysis, and considering other factors. The big picture is your lighthouse, guiding you through the choppy crypto waters.
Mastering Your Strategy
Once you’ve conquered chart reading, it’s time to craft your trading strategy. This involves setting entry and exit points, establishing stop-loss and take-profit orders, managing risk, and diversifying your portfolio. A well-thought-out strategy keeps your emotions in check and prevents hasty decisions driven by momentary price fluctuations.
Start with a Safety Net: Practice with a Demo Account
For fledgling traders, our advice is to dip your toes into the crypto world with a demo account. Binance generously offers this feature, allowing you to trade with virtual funds. It’s like a flight simulator for traders, letting you practice reading charts and testing various strategies without risking your hard-earned money. It’s the perfect training ground.
Never Stop Learning and Evolving
The world of cryptocurrency is in constant flux, and so should you be. Continuous learning and self-improvement are non-negotiable if you want to thrive in this ever-evolving market. Dive into online courses, devour books, follow blogs, watch video tutorials, and join communities of fellow traders. Stay adaptable, and success will follow.
In conclusion, chart reading on Binance is the cornerstone skill for rookie cryptocurrency traders. Understanding the core elements of charts, selecting the right time intervals, harnessing indicators and analysis tools, considering the broader market context, and devising a robust trading strategy will empower you to make enlightened decisions. And don’t forget, the learning journey never truly ends in the dynamic world of cryptocurrency. Good luck with your Binance trading adventures!
Frequently Asked Questions (FAQs)
1. How do I open a demo account on Binance? To open a demo account on Binance, log in to your Binance account (or create one if you don’t have it yet). Then, navigate to the “Futures” section and select “Demo Mode” to start practicing with virtual funds.
2. What are the best resources for learning about cryptocurrency trading? There are various resources available, including online courses on platforms like Udemy and Coursera, cryptocurrency trading books, informative blogs like CoinDesk, video tutorials on YouTube, and communities like Reddit’s r/CryptoCurrency.
3. How can I manage risk in cryptocurrency trading? Risk management is vital. Set stop-loss orders to limit potential losses, diversify your investments across different assets, and never invest more than you can afford to lose.
4. Are there any free chart analysis tools available on Binance? Yes, Binance offers several free chart analysis tools, including indicators like Moving Averages and Relative Strength Index (RSI). These tools can help you make informed trading decisions.
5. What is the significance of trading volume in chart analysis? Trading volume reflects the number of assets traded within a given time frame. High trading volume often indicates increased market activity and can be a valuable indicator of potential price movements.